Google Analytics 4: Tips & Tricks Every Marketer Should Know
At the beginning of July, Google retired its classic Universal Analytics, calling time on the reporting tool digital marketers have used for years, in favour of Google Analytics 4. And while you can still find the same metrics you’ve been reporting on, the new GA4 interface can be daunting.
Here, we’ll run through some of our favourite tips to using GA4, to help you get back into the swing of regular reporting.
Graph Trend Line Changes
One major update is the GA4 prebuilt graphs. But what if you want to graph something else? Just click on the ‘order by’ arrow in the table below to change the graph. No, not the column header, the ‘order by’ arrow.
Tabbed Explore Report
There are a lot of UA built-in reports that are simply not yet available for GA4, and a lot of the new features aren’t highlighted in the standard reporting, so you’ll be creating custom reports in the “Explore” area. As this is the new go-to for analysis — to prevent cluttering up the list of reports — you can create multi-tabbed reports for all the things you do most often.
From troubleshooting attribution issues to getting a regular overview of the metrics that matter to you most for the day-to-day running of the business, GA4’s explore report aims to speed reporting up.
At the top of your custom report is a little tab. Click the + to select the report type you’d like to add in. It’ll use the same variables as the root report, so you may find yourself with a long variable list, but at least everything you want to see will be available in one place.
User Acquisition Reporting
The biggest shift in switching from UA (apart from the move away from last-click attribution) is a bigger focus on users than sessions. Coming at your reporting from a user point of view is the cornerstone to spreading credit between multiple touchpoints, giving more insight into your customers than the snapshot moments in time that session-led reporting gave us in UA.
This data was sort of available in UA, to a degree, but hard to get to and very limited as to which metrics and dimensions it would play with.
Whilst it can be tough having 4 or 5 versions of a metric to give you flexibility as to how you look at the data, and there’s an investment of time needed to refamiliarise yourself with what the metrics you care about are now named — and which version of them you need to use. But taking this time to learn will be worth it when you improve your understanding of customer behaviour.
Customising the Default Reports
GA4 has a pretty sparse pantheon of default reporting. I used to have a default set of reports to run through when troubleshooting issues.
It usually got me a long way toward identifying where the problem lay before I’d need to create that one custom report to highlight it in an unequivocal manner.
Now the default reports are fewer, it can seem like they don’t meet your needs. However, with a little time investment, you can spruce them up and make them more fit for purpose.
Go to one of the reports and click on the pencil icon on the top right. This will bring up a report editor that is vaguely reminiscent of looker studio. From here, you can add metrics and dimensions, filter the data in the report, change chart types or hide them completely, as well as creating summary cards. You can either save over that existing report or create a new one.
Once you have some new reports— and want easy access to them — head to the report library and you can create a new “collection” to add in whichever reports you want.
The Report Library
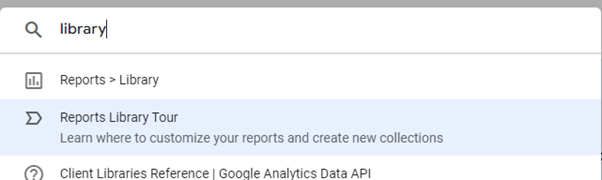
If you’ve just linked up search console with GA4 and are wondering why you can’t see any search console-specific reports, it’s because they’re neatly hidden away in the report library. The most effective way I’ve found to get access to the Report Library is to use the search bar at the top of the page — type in “library” and click on “Reports > Library”.
From here, you’ll be able to see “Collections” (grouped reports around a theme) that you can publish to make them visible in the reporting navigation, as well as other default and custom reports.
Email Alerts
GA4 creates insights for you when there’s enough data, but you can also create custom insights and link these up to generate email alerts to keep you informed if a KPI suddenly changes significantly.
Use the search functionality to find “Insights” then click create.
If you’re going to use this as a method of alerting you to significant changes, bear in mind that it does exclude app traffic, limiting you to web only.
From here, pick a KPI. If there’s enough data in your GA4 you can use the “Has Anomaly” condition. You can select some basic more than/less than filters, % increase/decrease of a given percent vs the same hour yesterday or last week, or a general % change vs the same.
Name the insight, add your email address (if it’s not already pre-populated) and hit “Create”* and you’ve got an email alert hooked up to your most important metric.
*it’s at the top of the page, which you likely can’t see now as the form has pulled you down below the fold. Goodness knows why they did this sort of thing throughout GA4 but, until it gets a refresh in the design department, we just have to live with it.
New Audiences Report
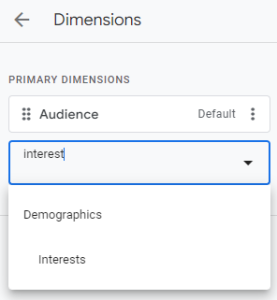
This is a pretty new addition. If you look through the report library you may see (I’ve seen it on some accounts, but not all) a new audience report. The default setup here is to show created audiences, but you can edit it to add “Interests” (the new equivalent of affinity audiences).
Now that Google has officially retired Universal Analytics (to a degree, UA is still processing data in order to provide a phased-out approach) it’s time to get used to using GA4. As with any analytics tool, practice makes perfect, and you’ll no doubt develop your own unique way of tracking and reading the data in GA4.
It’s simply a matter of getting used to the new interface and knowing where to find your KPIs. And the best way to do this is to start using it.
We can provide extensive GA4 training for you and your team, and even set up your Google analytics for you, if needed. Get in touch with our team to find out more about how we can help.